
Radon levels in real-time
Radon levels are highly localised, for accurate data in your property sign up for one of our Real-time Radon plans. Free plans are available.
With a free plan your data will be anonymously displayed on this map. Paid plans give you the option not to display on the map.
Why test and monitor radon?
Radon is the second largest cause of lung cancer.
3.3% of lung cancer deaths in the UK are caused by Radon exposure. However, not all areas are effected. The west, particularly the south west, has the highest levels of Radon in the UK.
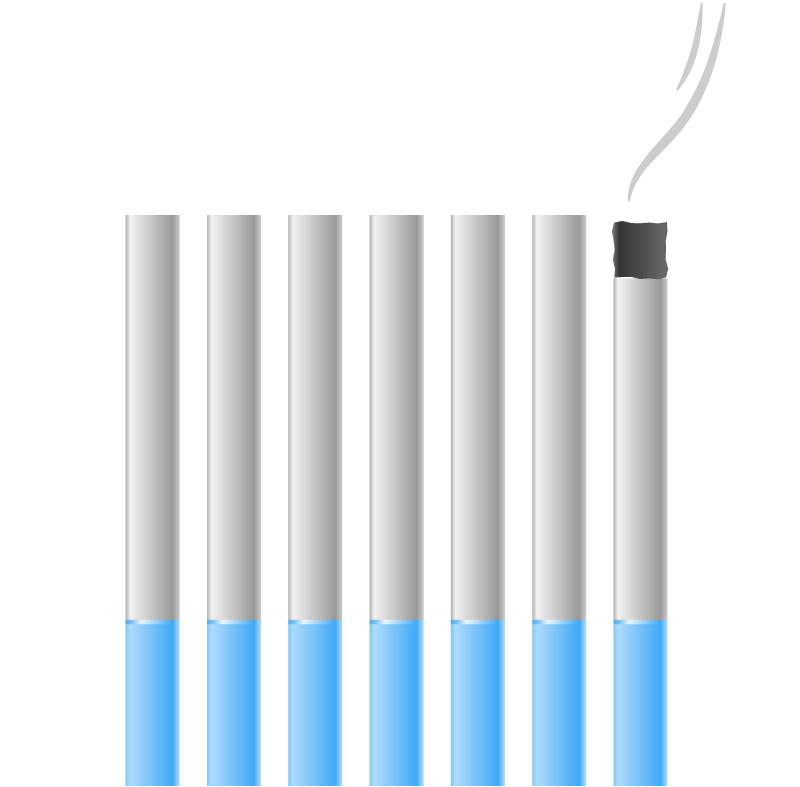
Radon and cigarettes have a synergistic effect. You are far more at risk of radon as a smoker. Former smokers are more at risk than non smokers, but not as at risk as active smokers.
A radon level often considered “low” is the equivalent of up to 7 cigarettes per day.
The World Health Organisation (WHO) advises a 2.7 pCi/L level of radon requires action. However, in terms of risk, this is the equivalent of smoking around 4 to 7 cigarettes per day.
You cannot see, smell or taste radon.
Testing is the only way to detect radon. Levels fluctuate and are highly localised. So an in-home monitor is the best way to determine your risk level.
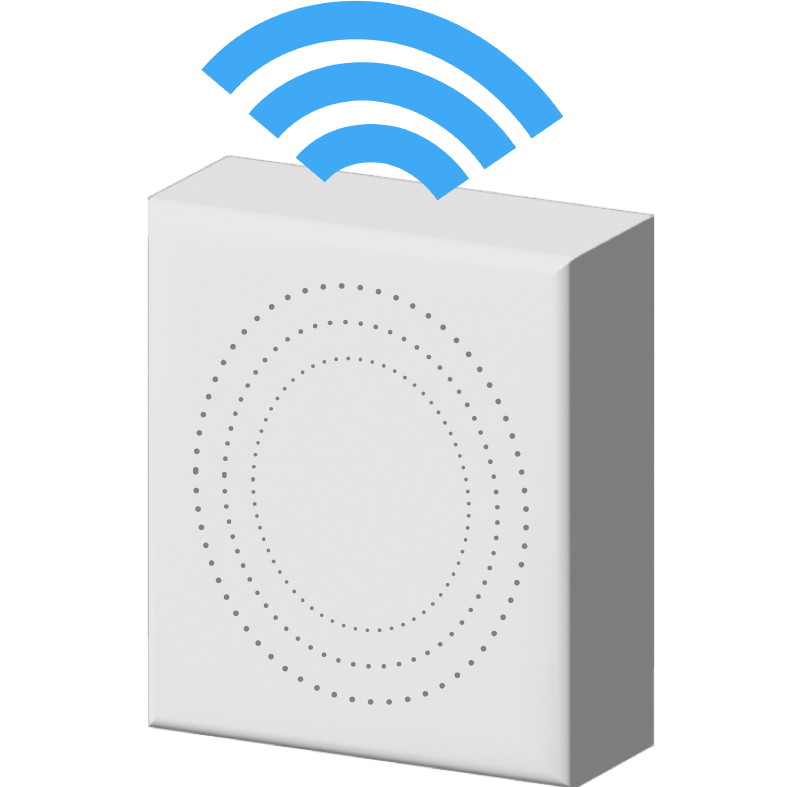
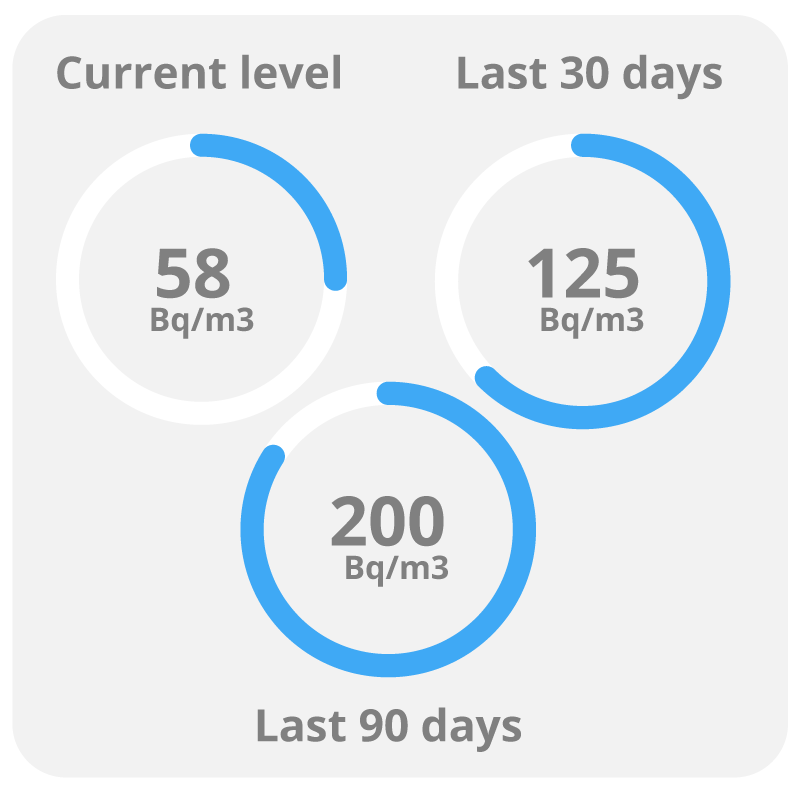
Real-time Radon gives you up to the minute data.
Radon levels change throughout the day. With Real-time Radon you can see where and when your radon levels rise. This data can be used by professionals to install the right mitigation system.
Steps can be taken to reduce radon levels in your home.
Using your Real-time Radon data dashboard you can see whether action is needed to reduce radon in your property. Some actions can be as simple as sealing a loft hatch. Others can be more involved like installing a sump or ventilation system.
